Screenshots
A visual tour of Jetic Studio, the CLI, and workflow execution traces.
A gallery of the Jetic interfaces. Every image below is a live capture of the tooling described throughout these docs.
The CLI
Running jetic init / jetic scan from a project root.
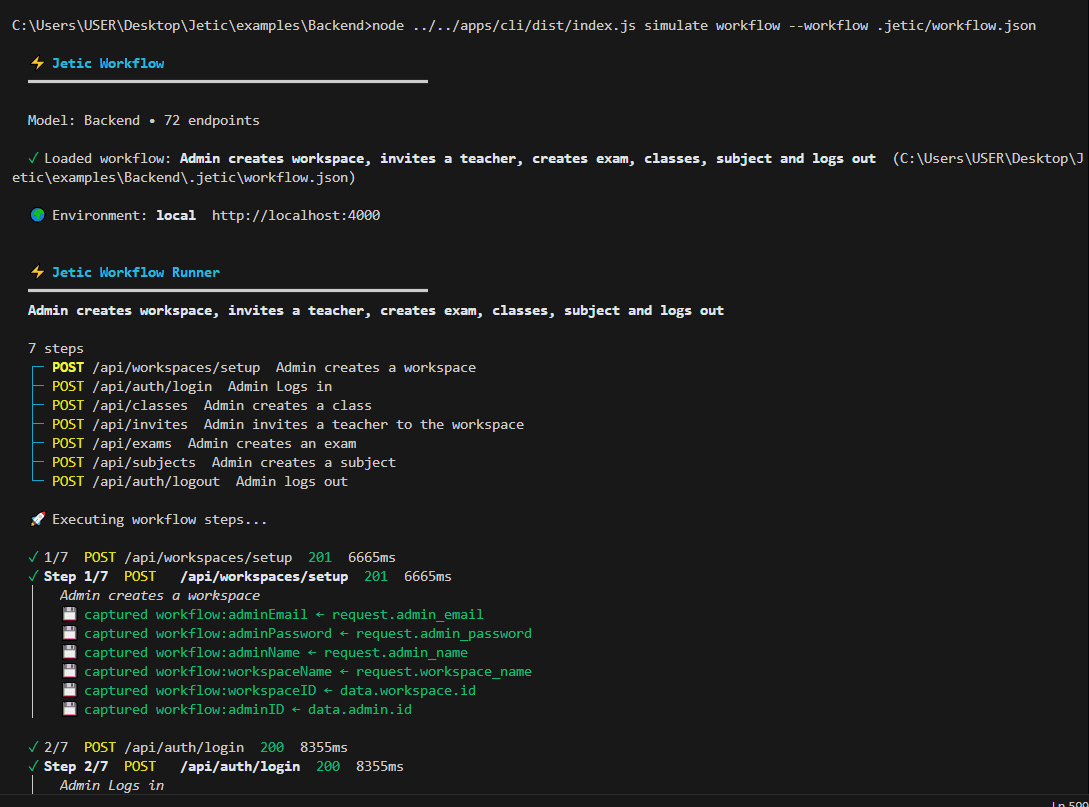
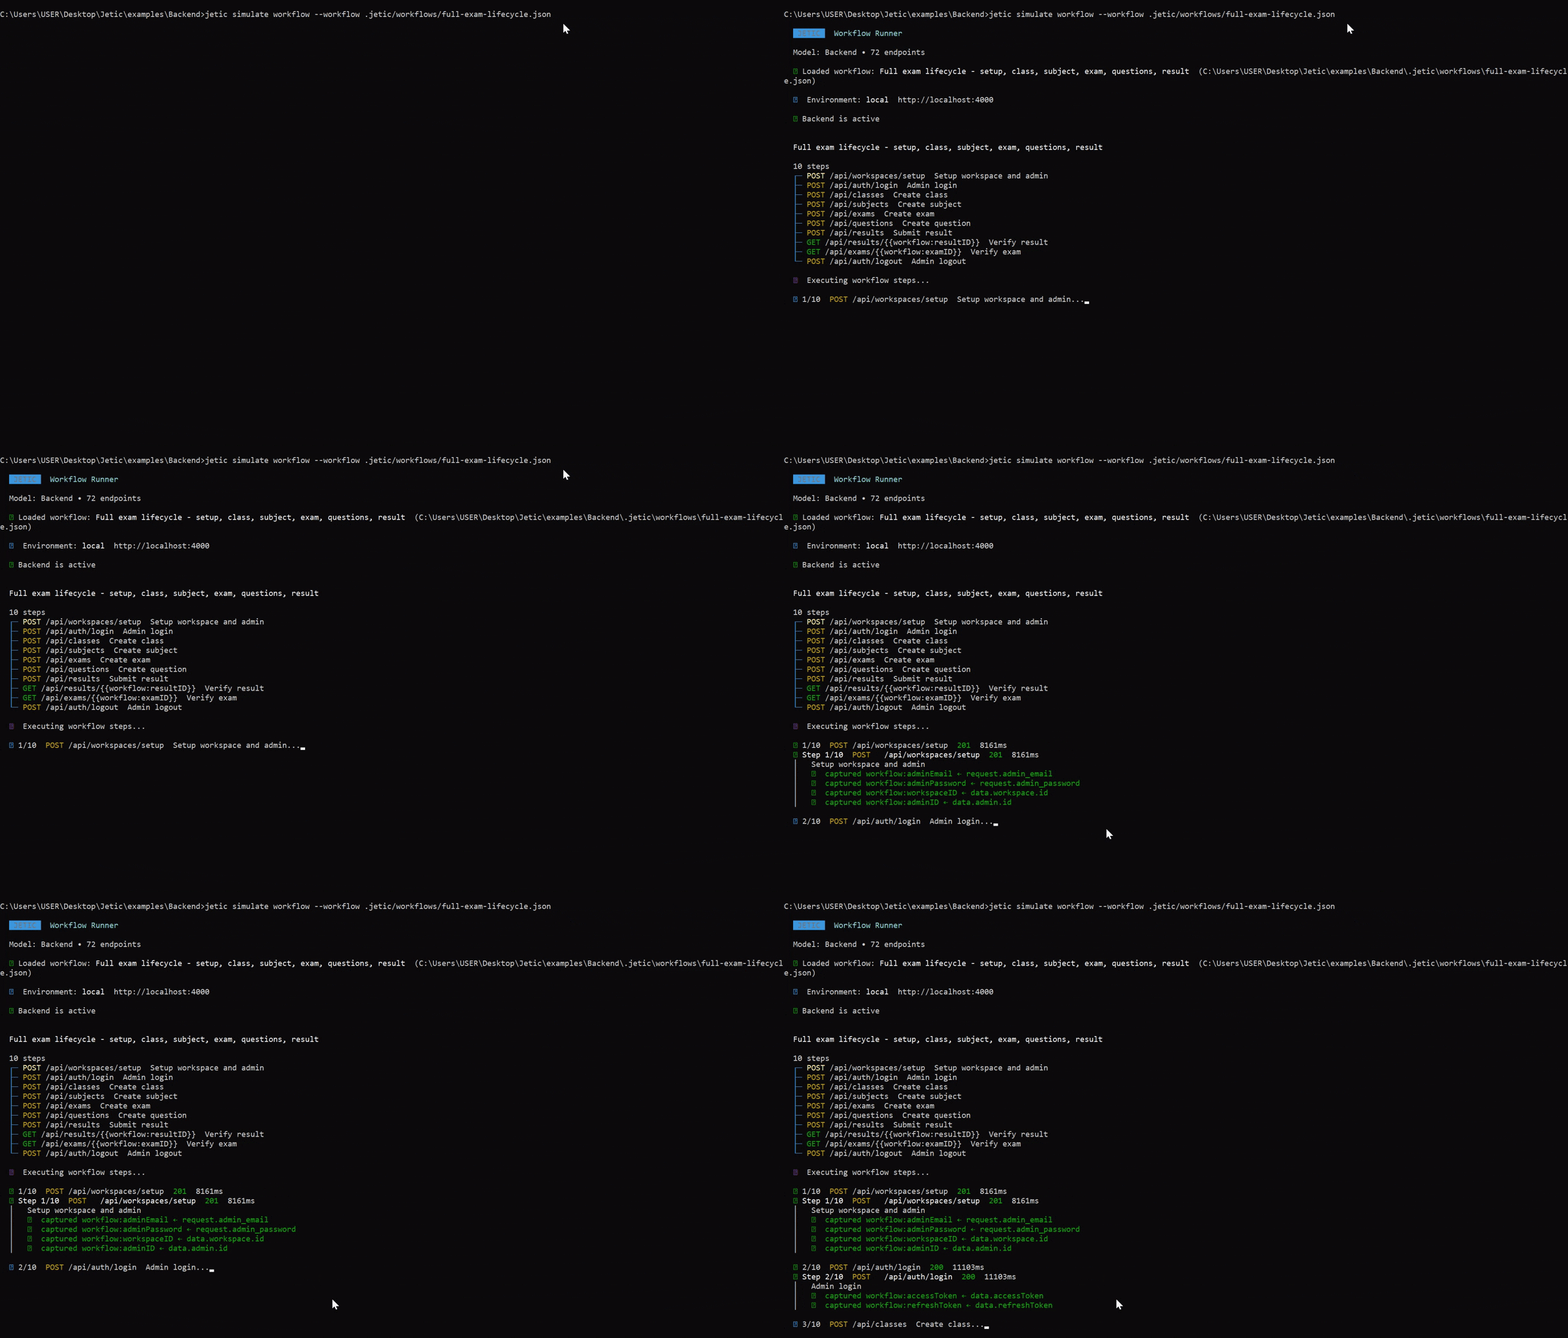
Jetic Studio — Workspace Overview
High-level model metrics, method breakdown and security posture.
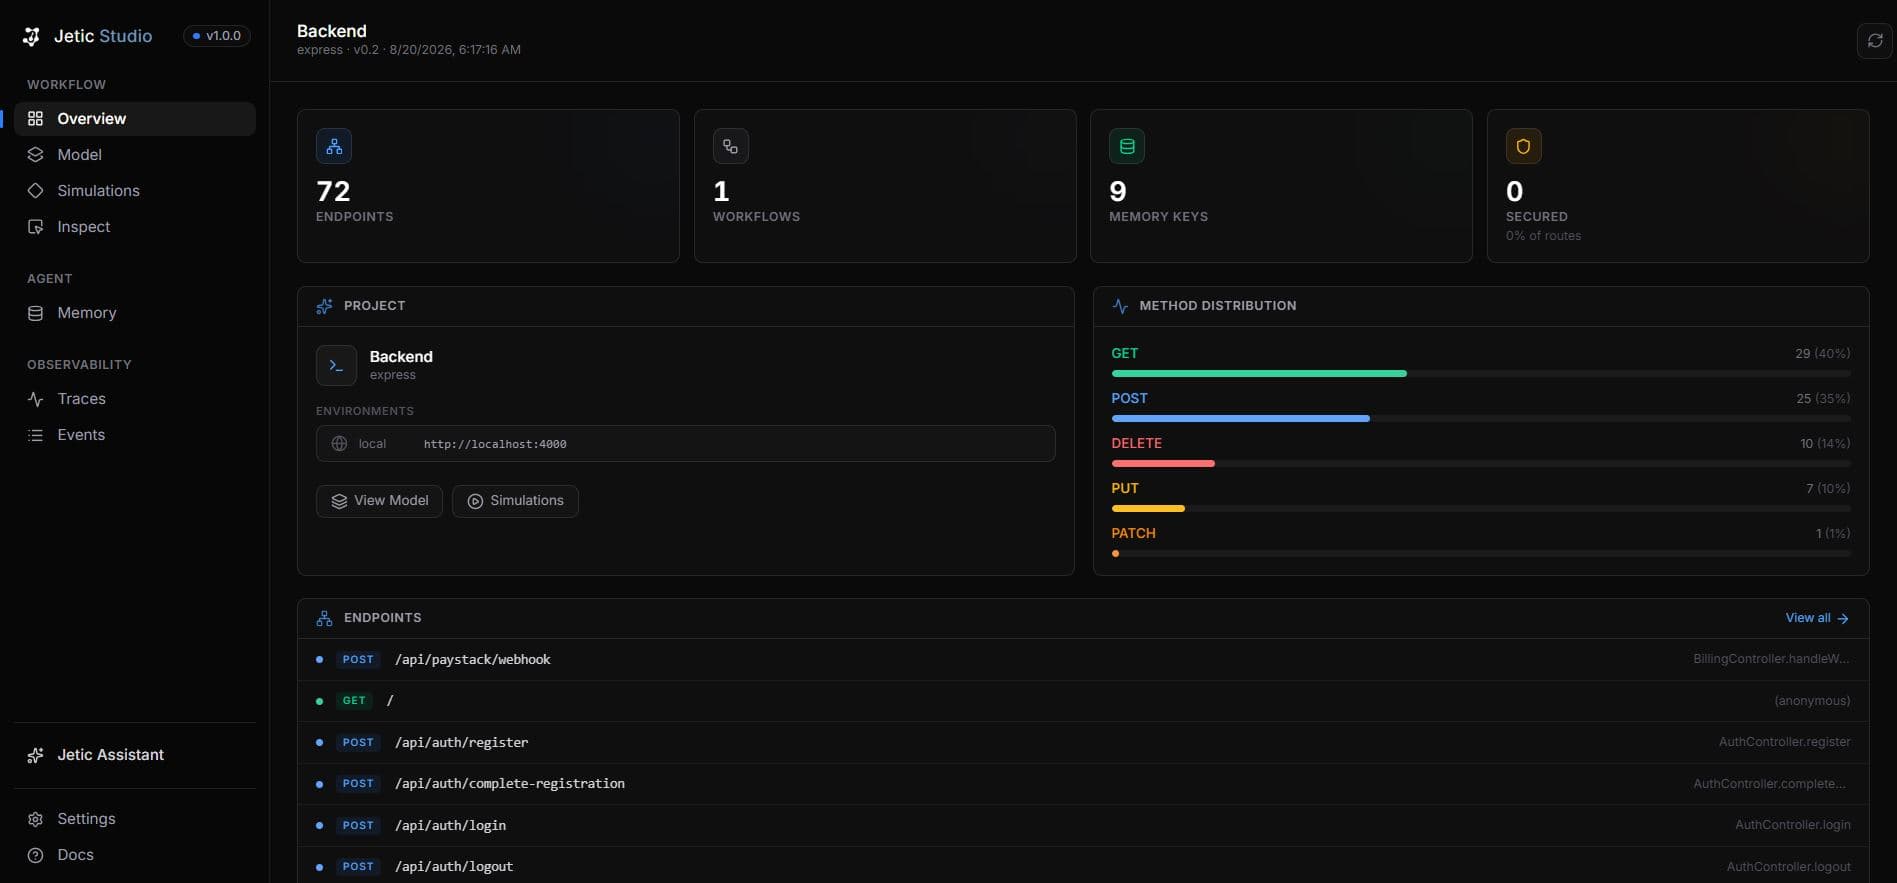
Jetic Studio — Behavioral Model
Browse, filter, and search endpoints; add endpoints manually for any stack.
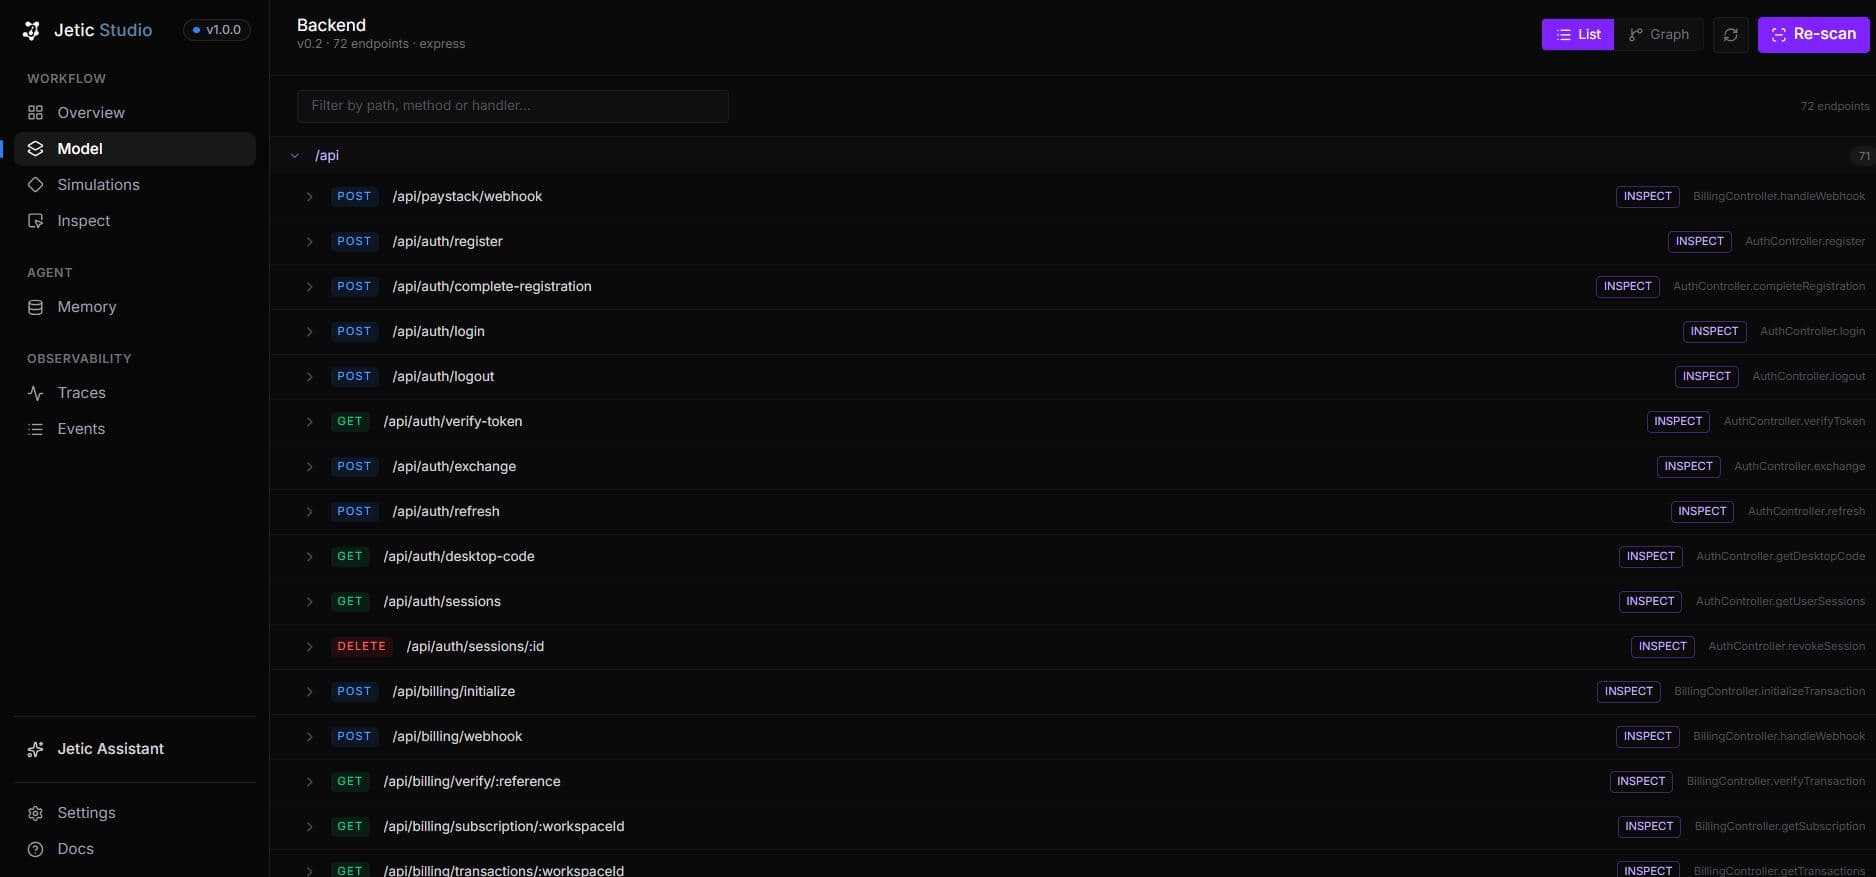
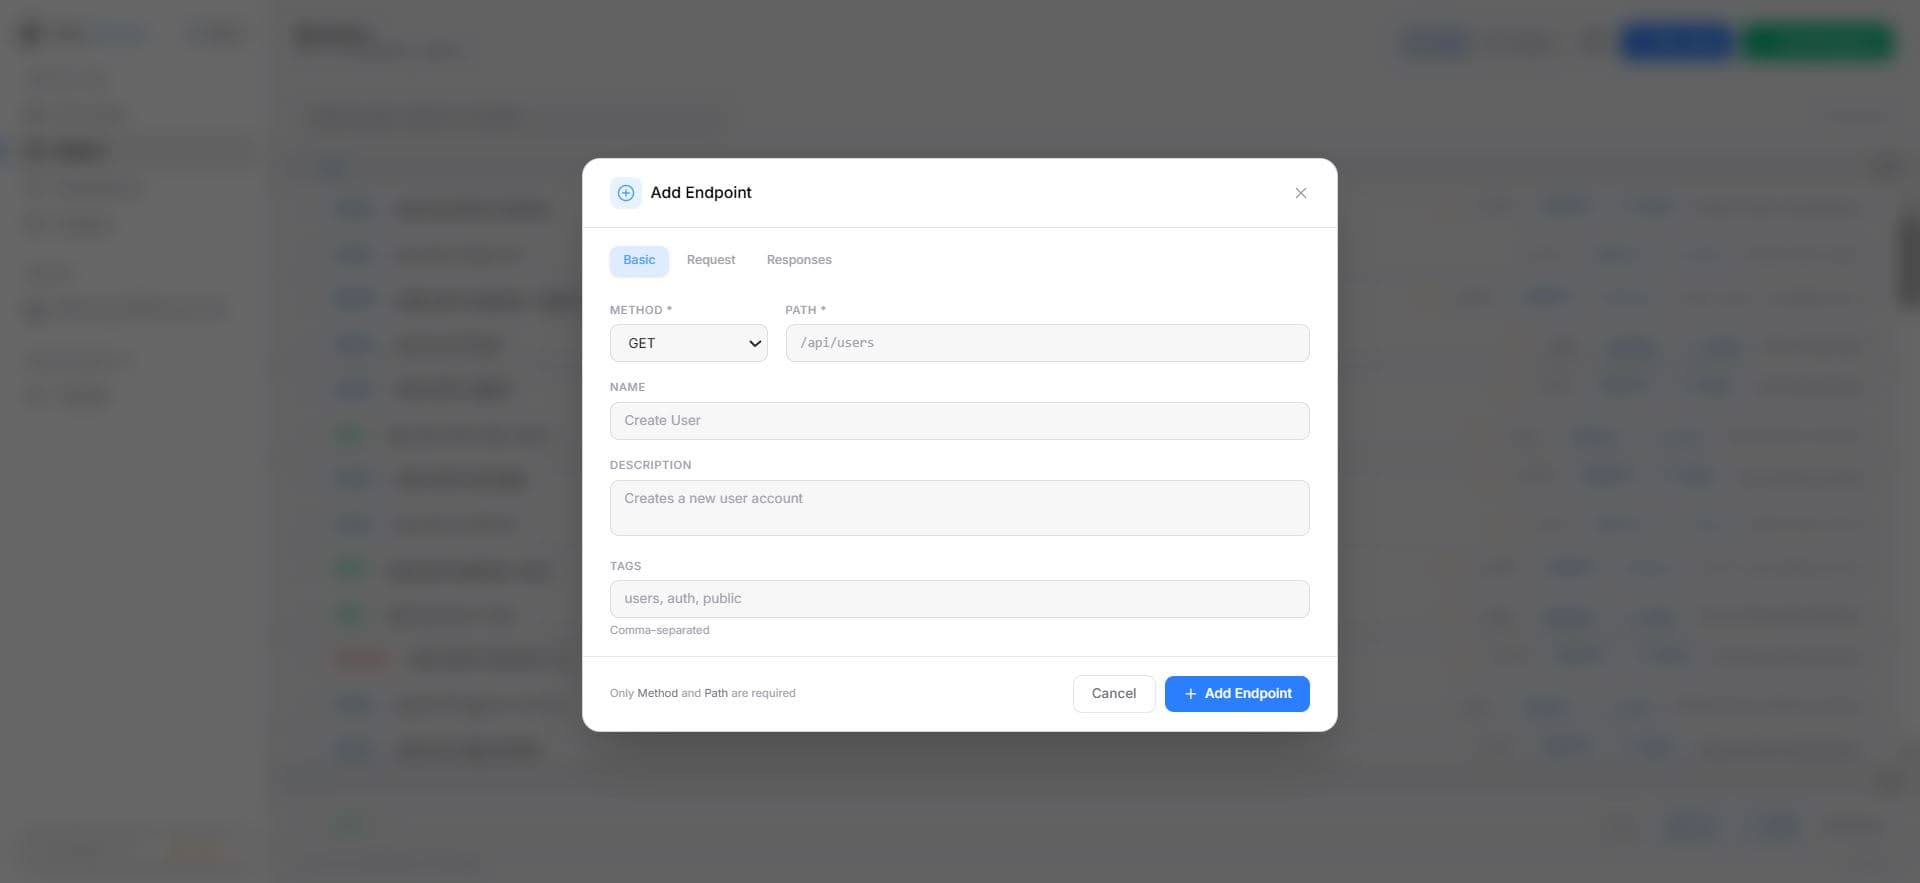
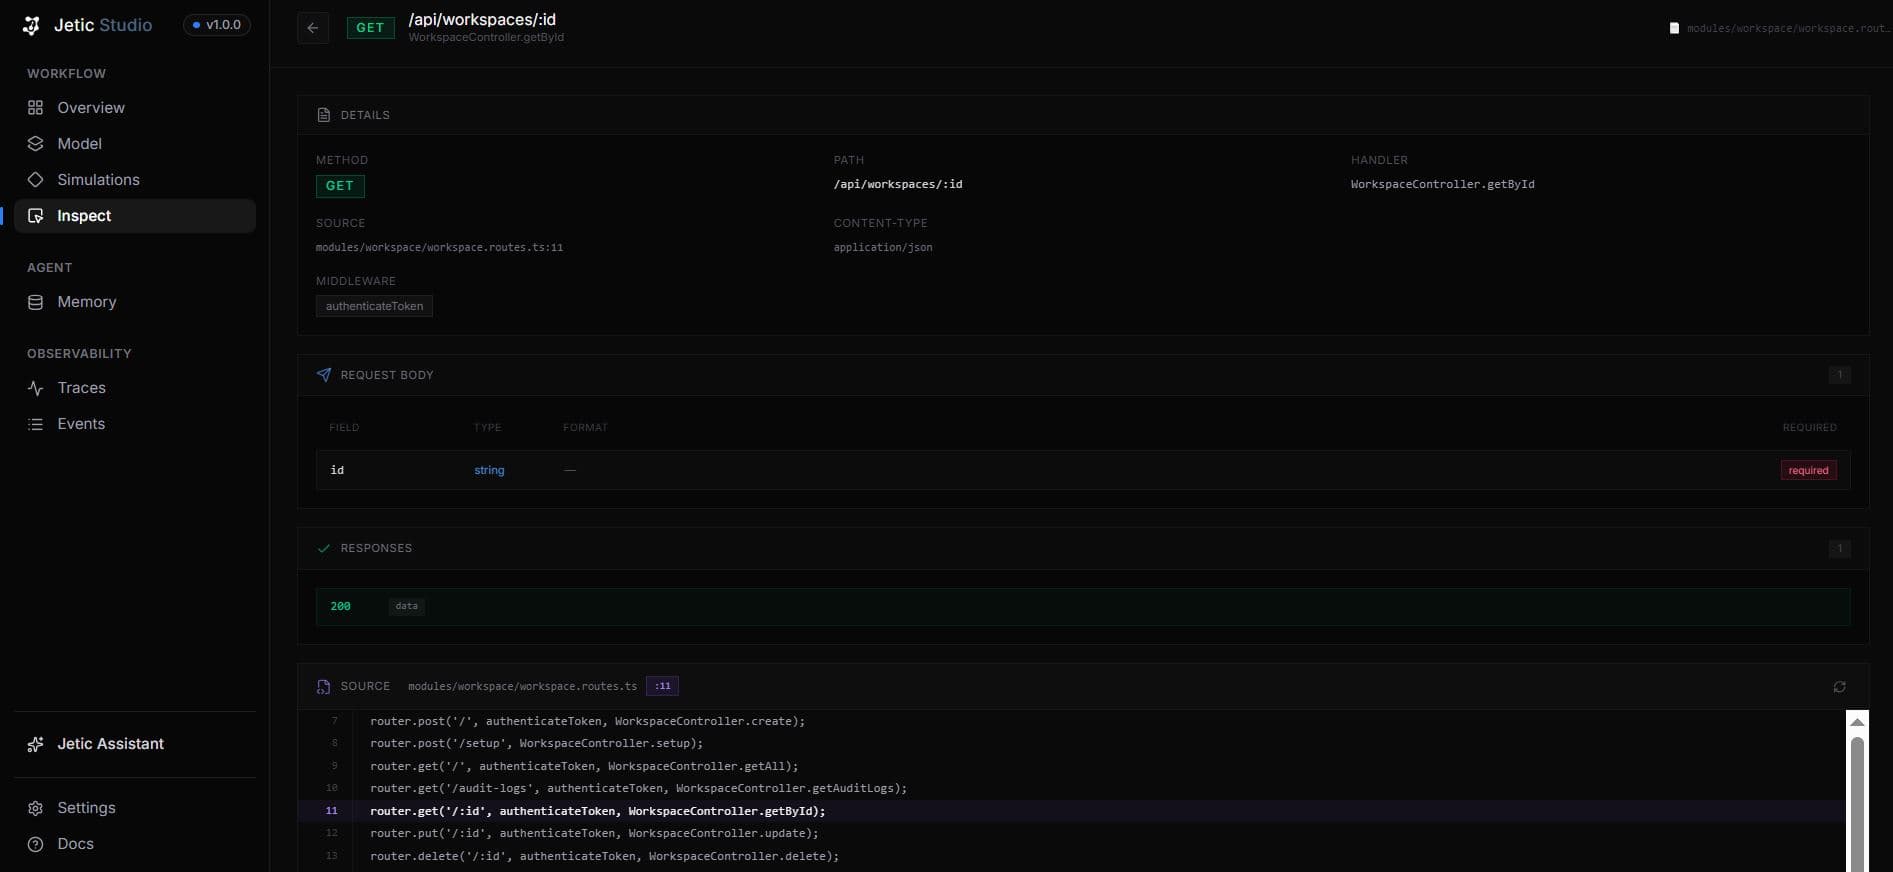
Jetic Studio — Endpoint Inspect
AST source viewer, related files, schema explorer and an interactive REST client.
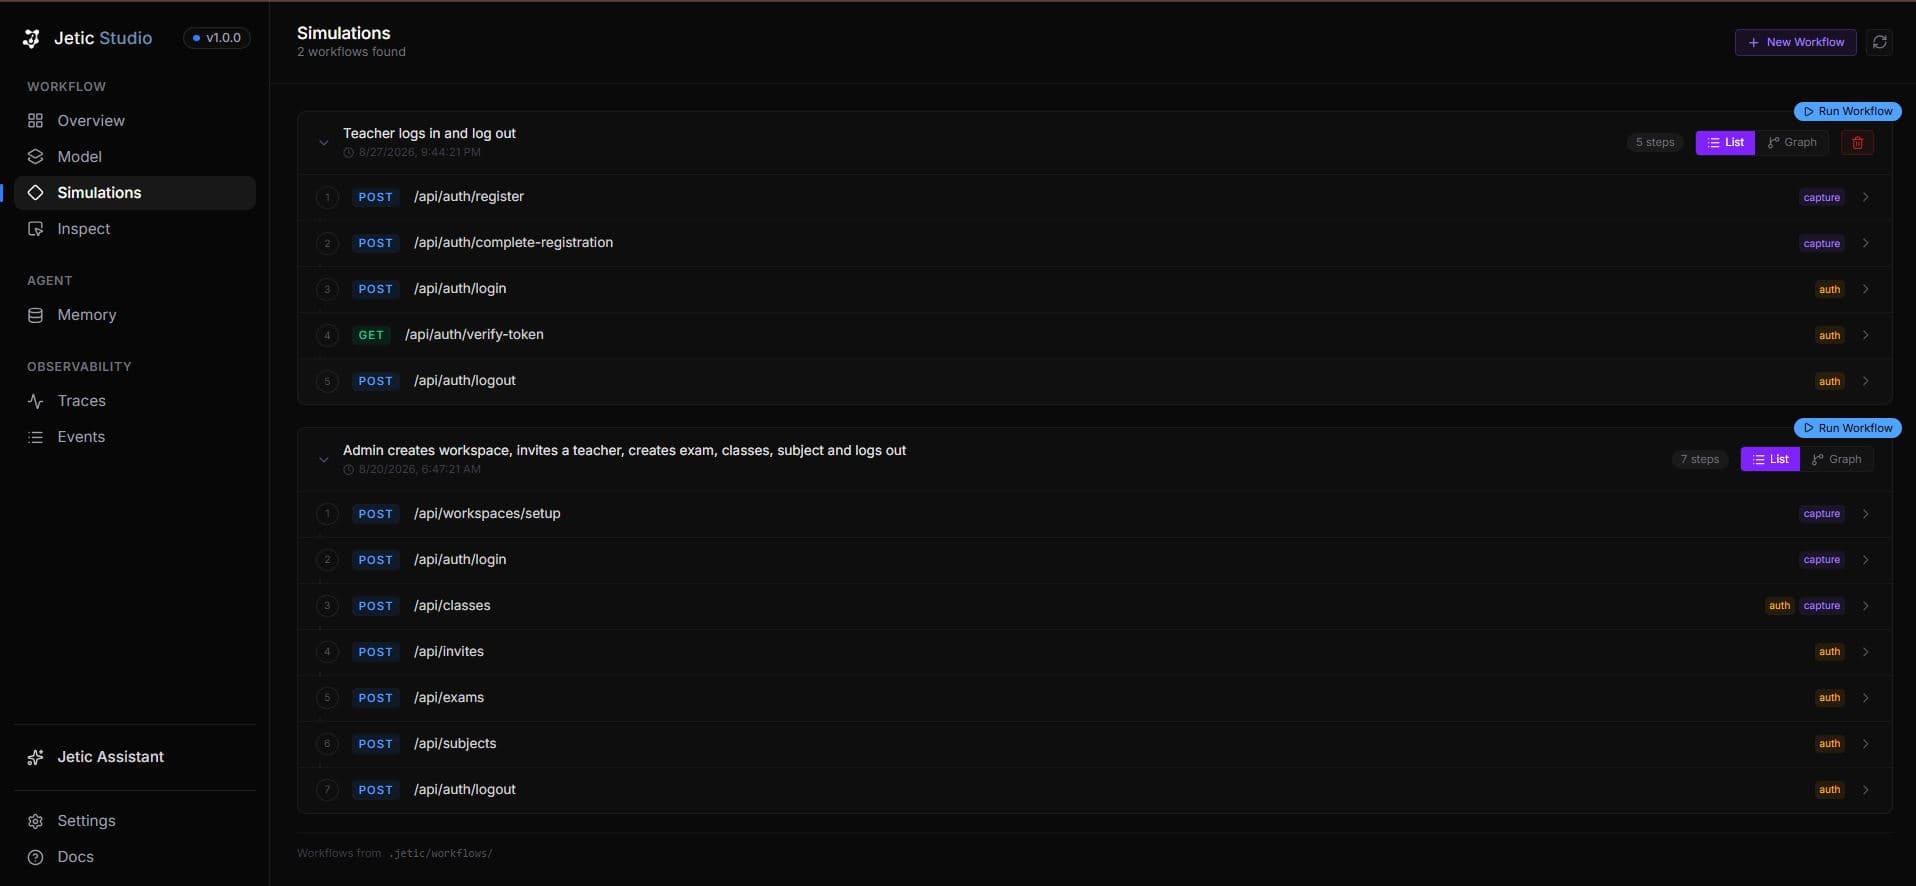
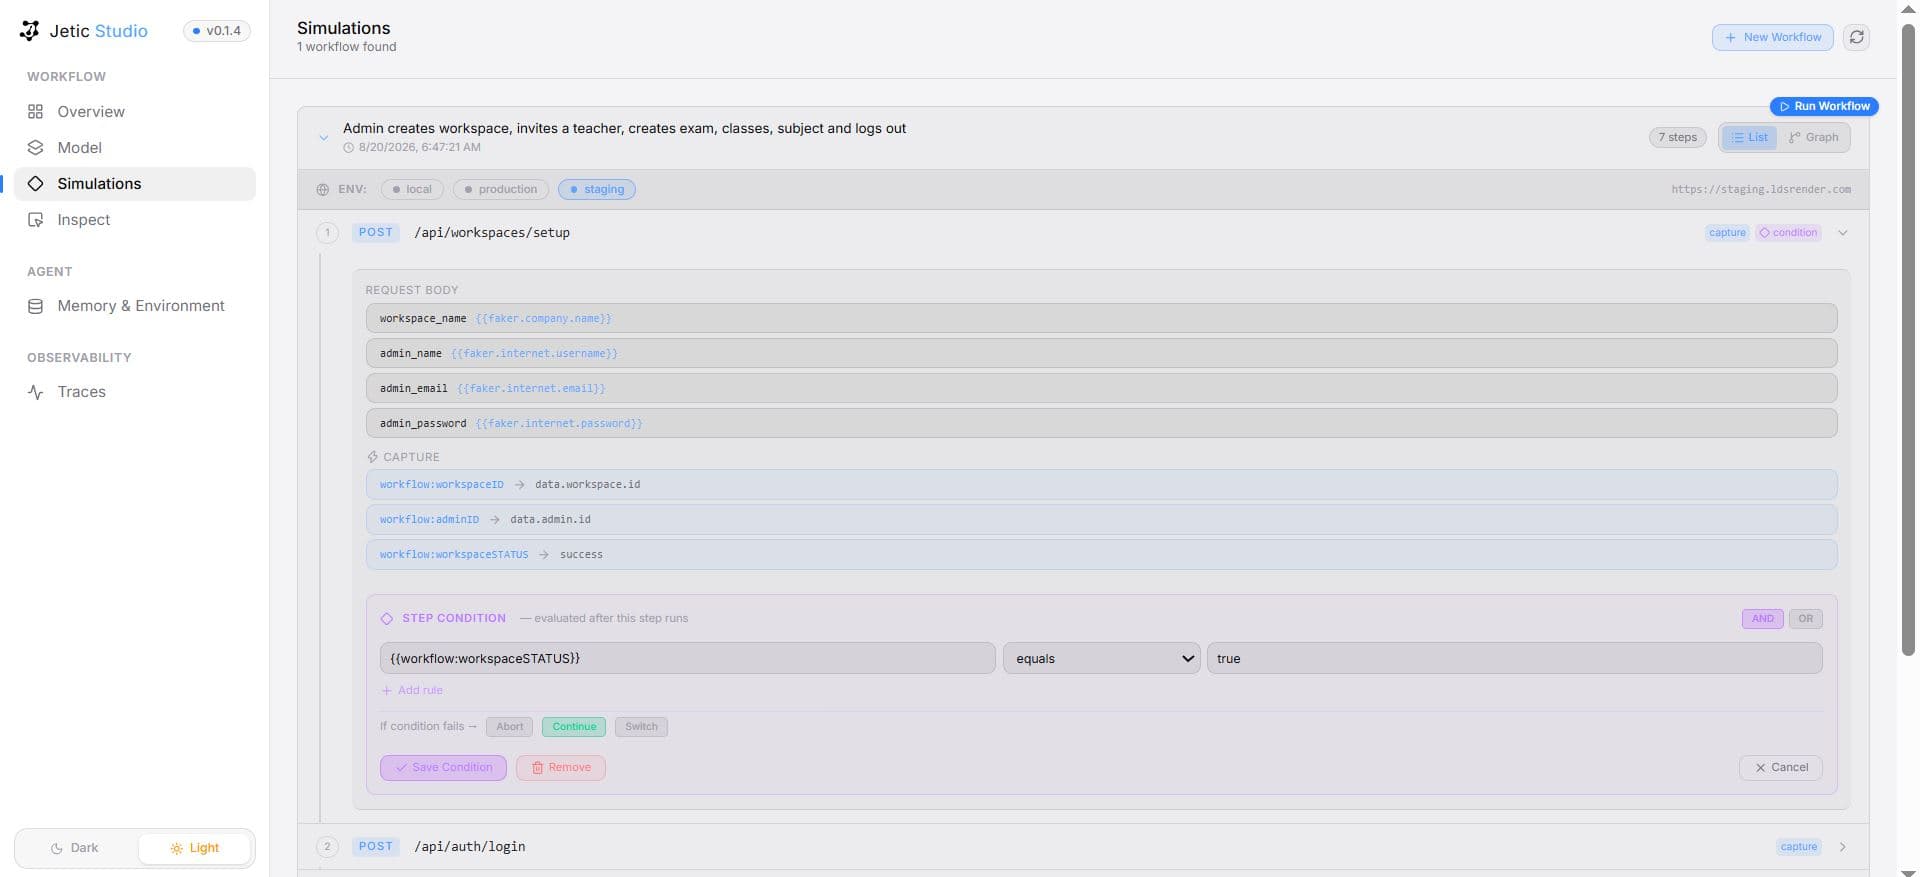
Jetic Studio — Simulations
Saved workflow runner with live SSE execution and expandable step detail.
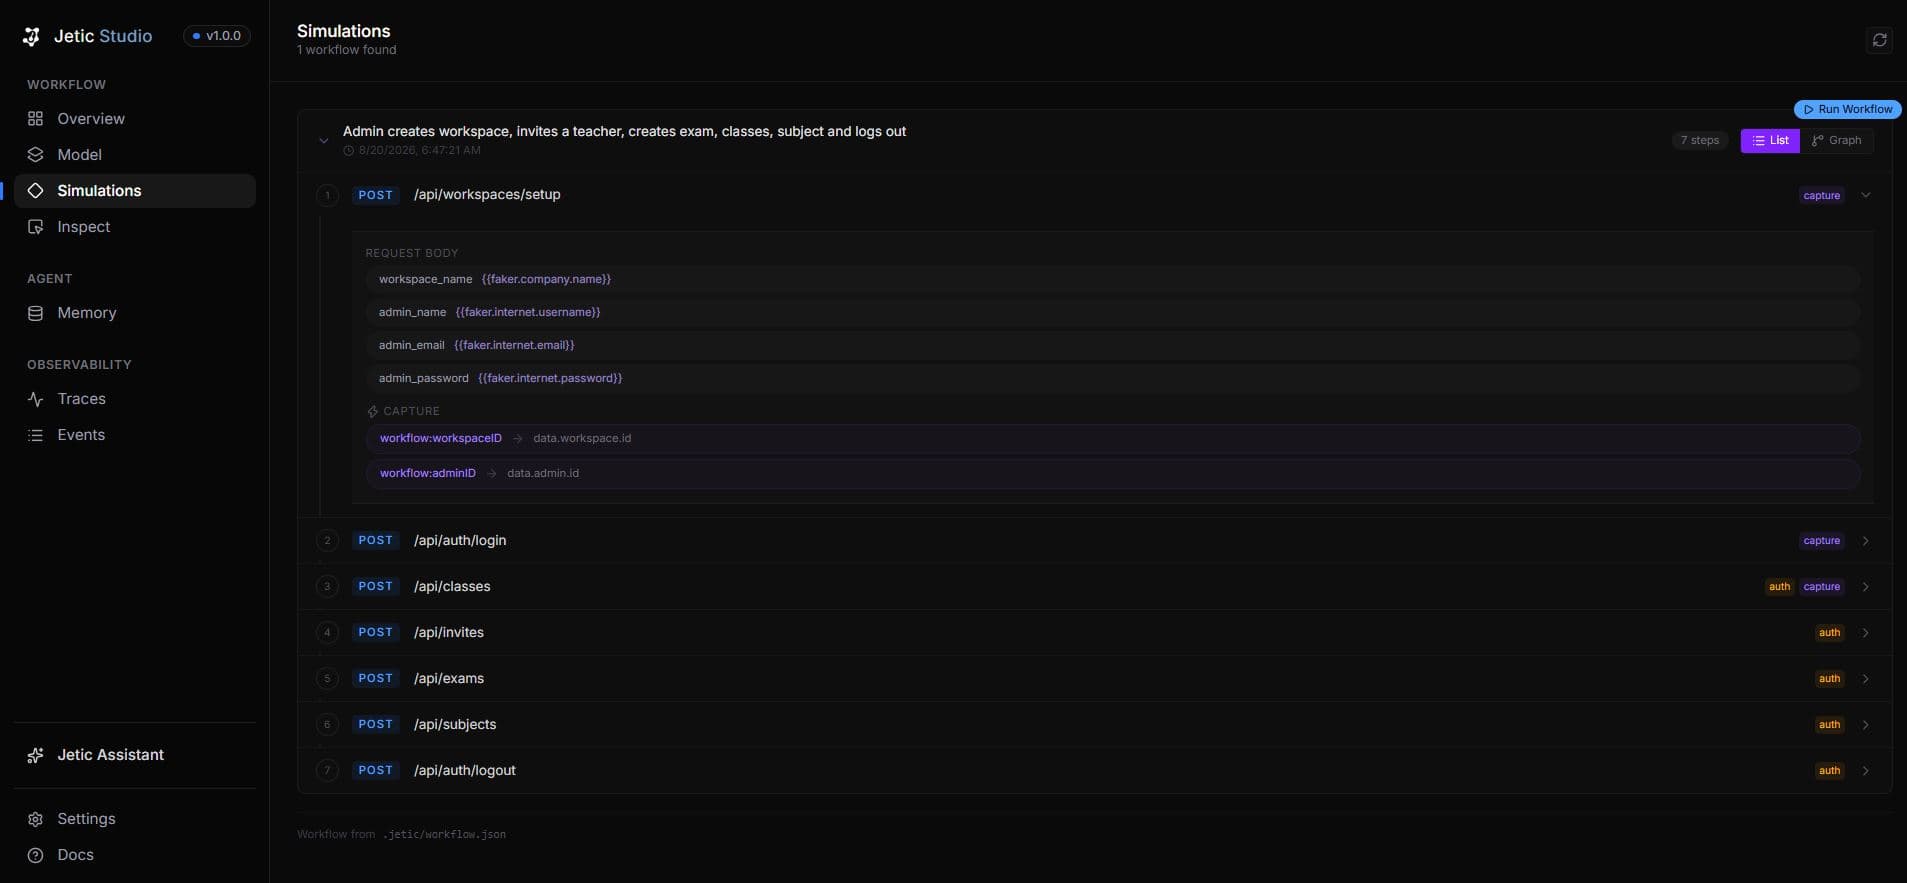
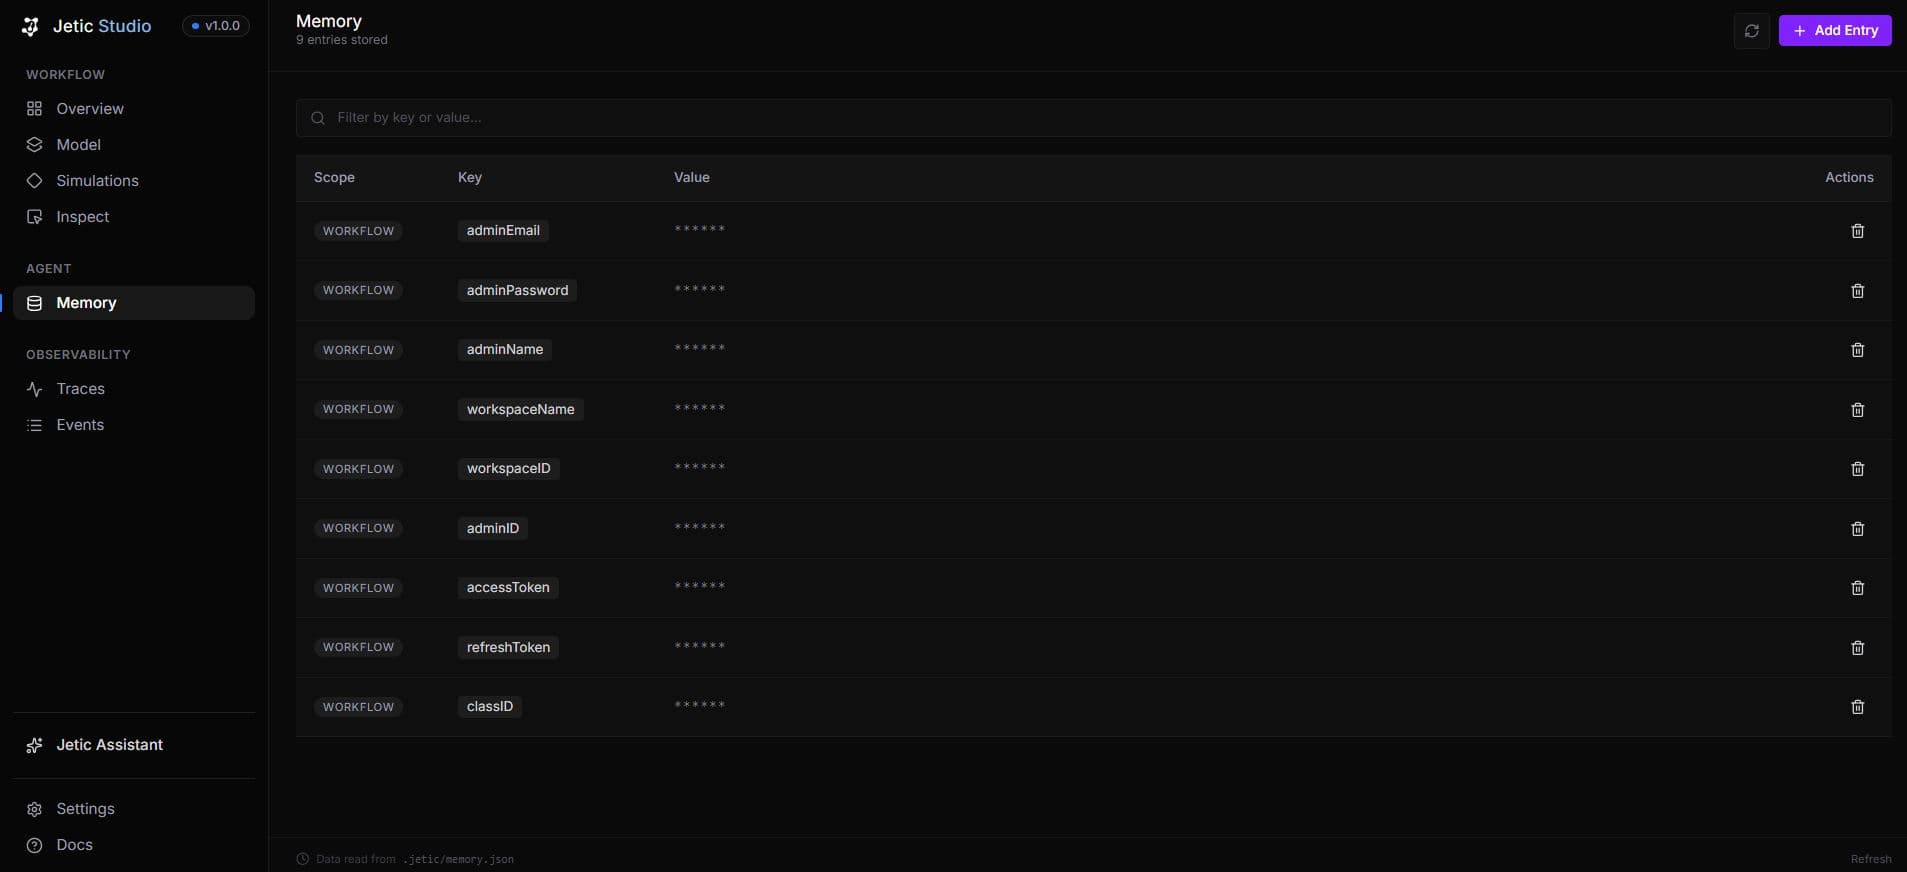
Jetic Studio — Memory Inspector
Captured tokens, credentials and variables across workflow and global scopes.
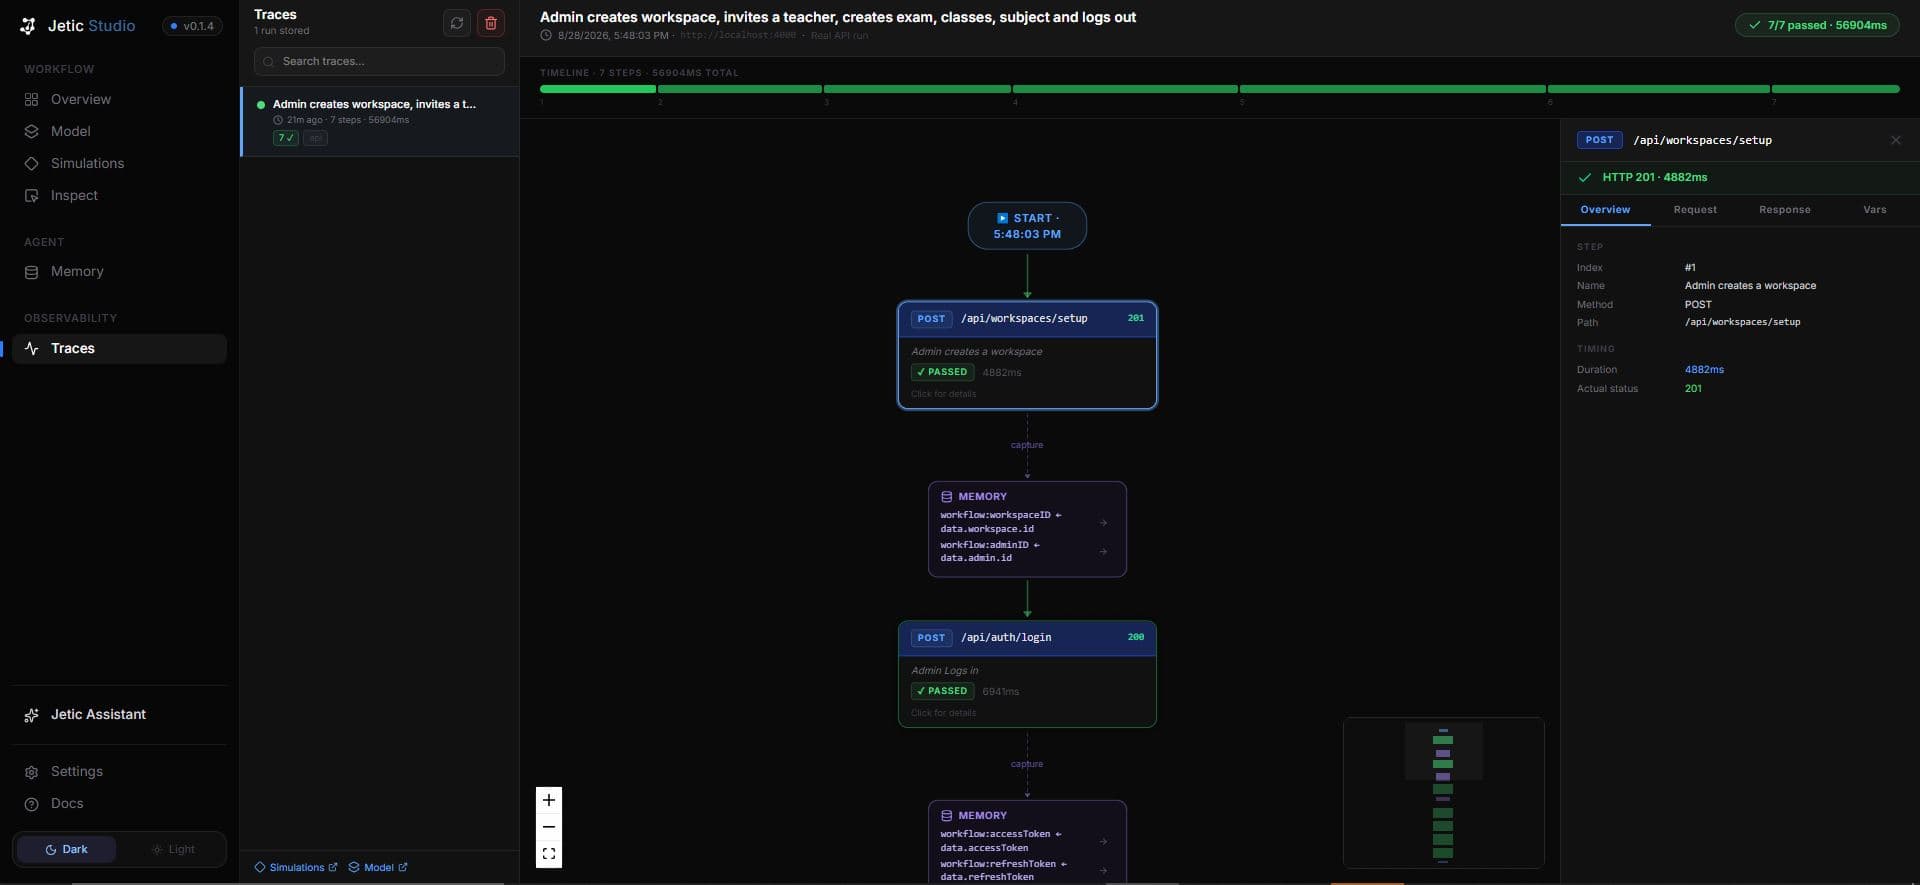
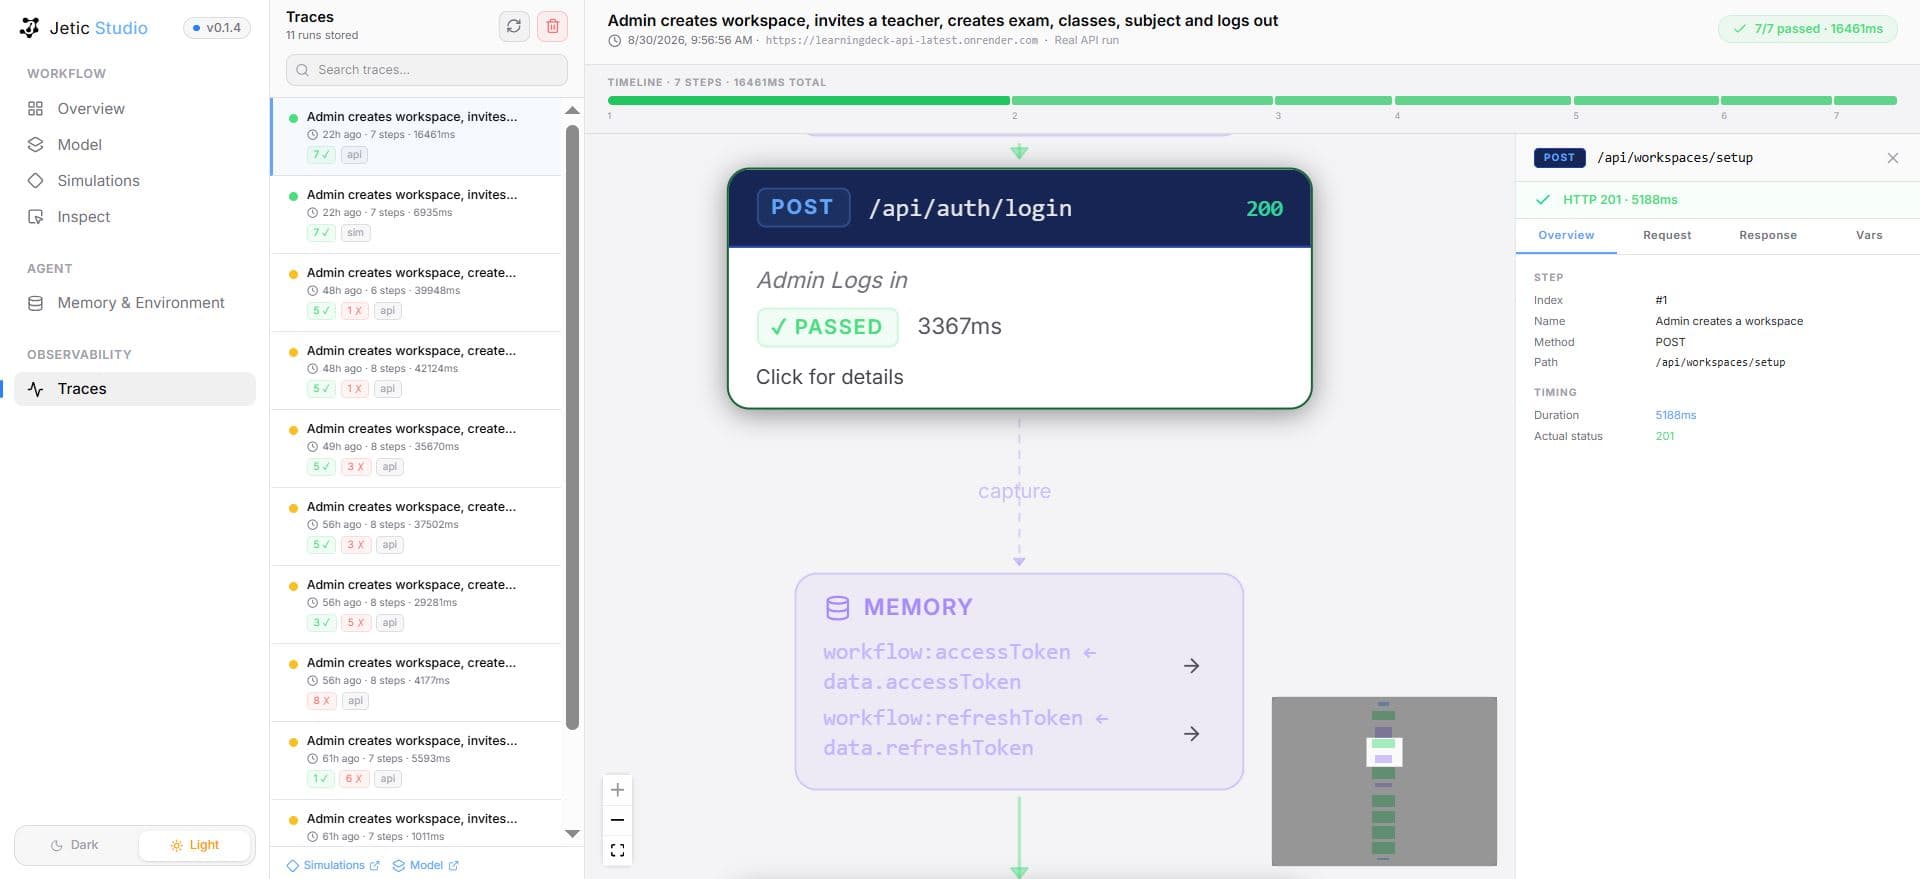
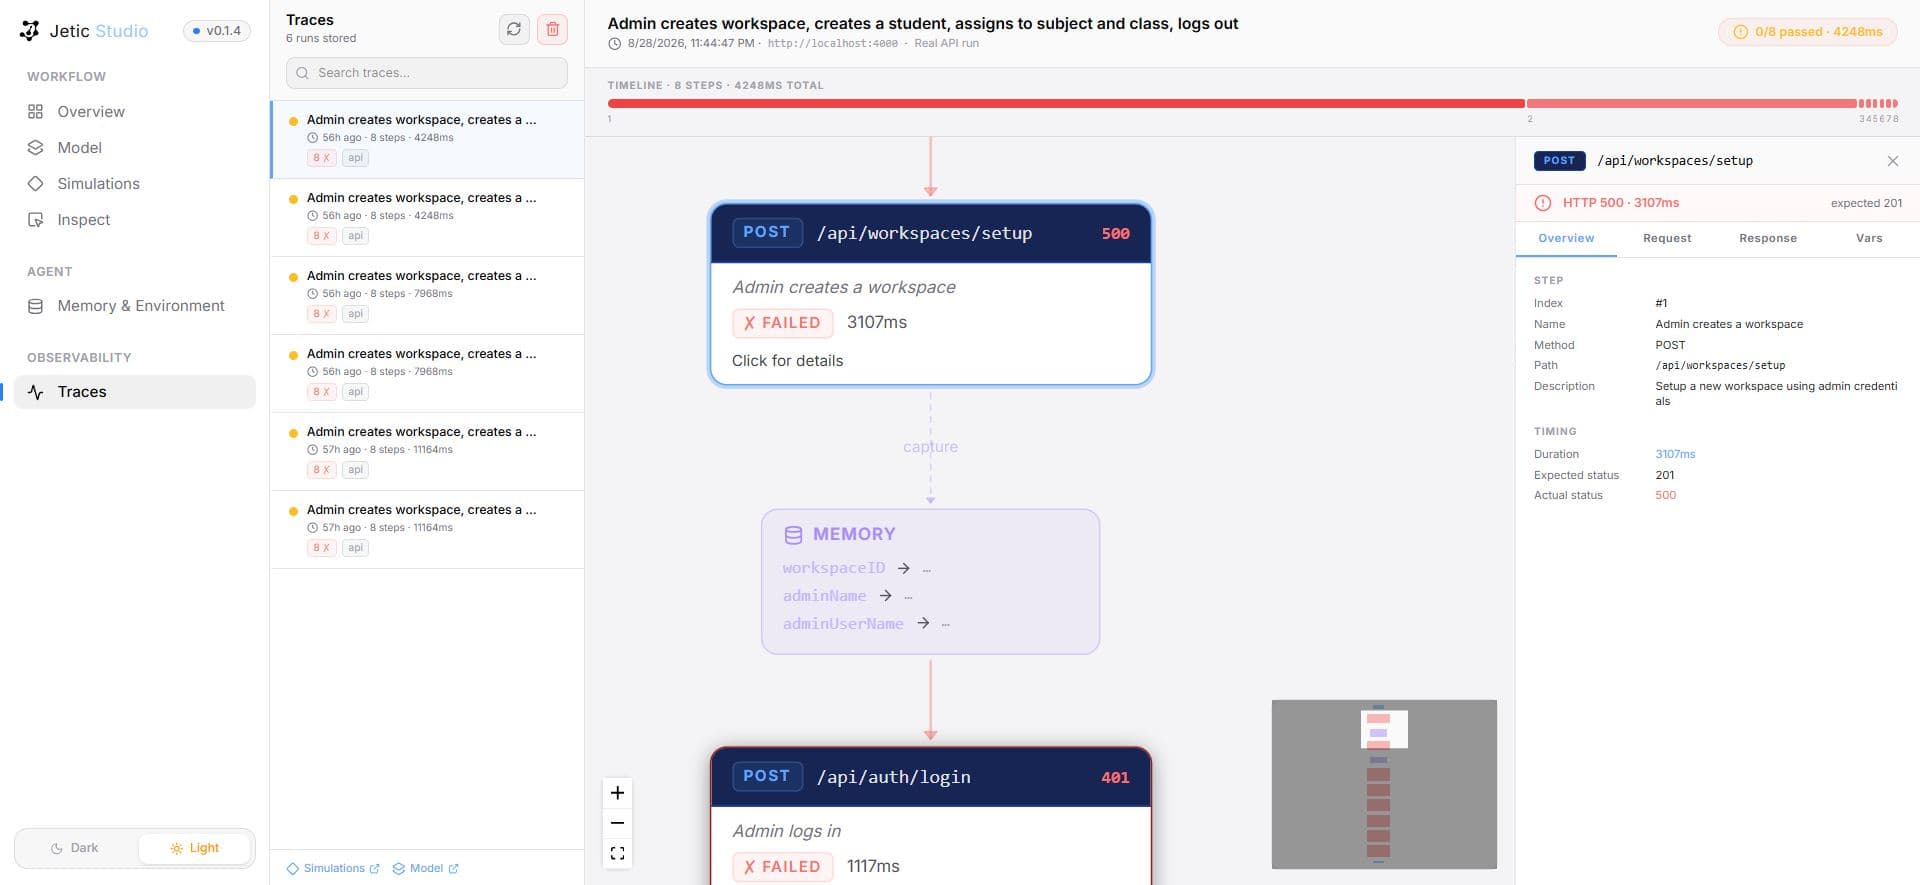
Jetic Studio — Execution Traces
Node-graph visualization of run results, including success and failure states.
Screenshots are captured with a live server
These views render live data from .jetic/model.json, .jetic/memory.json, and .jetic/changes.json. Start them with jetic dev against a running backend.